Cats outnumber dogs in Europe. Does your creative budget know that? (2026)
Europe has 111 million cats and 91 million dogs, and cat food is 50% of pet food sales value. Here is the data by country and an audit to check whether your creative plan follows that split.
Cats outnumber dogs in Europe, with 110.9 million cats and 91.2 million dogs in FEDIAF's 2024 figures, and cat food earns 50% of European pet food sales value against 46% for dog food. The lead is not universal: the UK, Poland and Spain have more dogs. Pet food brands should compare their cat revenue share with their cat creative share, market by market.
Image generated with AI: an indoor cat in a city flat, one of the cat situations a pet food creative plan should cover.
Cats outnumber dogs in Europe by almost 20 million, and cat food now earns more than dog food. FEDIAF, the European pet food industry federation, counts 110.9 million cats and 91.2 million dogs across 41 countries in its 2026 report, and cat food takes 50% of European pet food sales value against 46% for dog food (FEDIAF Annual Report 2026).
So check your own split.
No published data shows how European pet food brands divide creative production between cats and dogs, so nothing here claims the category is biased toward dogs; what follows is the data and an audit you can run on your own plan in an afternoon.
Are there more cats than dogs in Europe?
Across Europe, yes. FEDIAF's 2024 figures put 110.9 million cats and 91.2 million dogs in European homes, out of 306 million pets living in 140 million households (FEDIAF statistics).
Country by country, the answer splits. France has 16.7 million cats against 9.7 million dogs, Germany 15.9 million against 10.5 million and Italy 11.9 million against 9.0 million. The UK, Poland and Spain go the other way.
Cats lead in France, Germany and Italy; dogs lead in the UK, Poland and SpainCats and dogs kept in homes, millions, 2024
Cats
Dogs
17m
9.7m
France
16m
11m
Germany
12m
9m
Italy
12m
13m
United Kingdom
7.5m
8.3m
Poland
4.9m
7m
Spain
3m
1.7m
Netherlands
1.7m
1.2m
Sweden
Cats lead in France, Germany and Italy; dogs lead in the UK, Poland and Spain. Cats and dogs kept in homes, millions, 2024
Item
Cats
Dogs
France
17m
9.7m
Germany
16m
11m
Italy
12m
9m
United Kingdom
12m
13m
Poland
7.5m
8.3m
Spain
4.9m
7m
Netherlands
3m
1.7m
Sweden
1.7m
1.2m
FEDIAF Annual Report 2026, Facts and Figures (data year 2024), country tables; Poland, Spain, Netherlands and Sweden rounded to one decimal
Dogs lead the UK by a wide margin. UK Pet Food's January 2026 survey of 8,951 adults counts about 15.5 million dogs in 41% of households against about 13 million cats in 31% (UK pet population). A pan-European plan that copies a UK-led weighting will underweight cats in most of the other large markets.
Cat food vs dog food: which is the bigger market?
By value, cat food. FEDIAF reports that dog food makes up 58% of the pet food Europe produces by volume and cat food 41%, yet in sales value the order flips: cat food 50%, dog food 46%.
Dog food leads on volume, cat food leads on valueShare of European pet food by volume produced and by sales value, 2024
Dog food leads on volume, cat food leads on value. Share of European pet food by volume produced and by sales value, 2024
Item
Share of volume
Share of value
Cat food
41%
50%
Dog food
58%
46%
FEDIAF Annual Report 2026, Facts and Figures (data year 2024); the value split covers 11 national associations representing 91% of reported volume
Format explains most of the gap. In FEDIAF's figures 61% of cat food volume is wet food against 30% for dogs, and wet food carries a higher price per kilo; by value, wet food is 60% of cat food sales and 23% of dog food sales. The value split rests on 11 national associations covering 91% of reported volume, so treat it as a strong estimate for Western Europe.
Germany shows the same pattern in stores. IVH and ZZF report cat food sales of a good EUR 2.3 billion in 2025, up 1.3%, and dog food about EUR 1.8 billion, down 0.3% (Der Deutsche Heimtiermarkt 2025). In its world pet care report, Euromonitor puts cat food growth at a compound 6% a year from 2020 to 2025 against 3.8% for dog food (Euromonitor, November 2025).
How do cat owners buy pet food differently from dog owners?
They buy more wet food, more often, for more animals, and they see the vet less. Each difference changes what an ad has to do.
How cat and dog buyers differ, with the source for each row. Shares are from different surveys and countries and should not be added or compared across rows.
Signal
Cats
Dogs
Source
Wet food share of volume, Europe 2024
61%
30%
FEDIAF Annual Report 2026
Homes with two or more of the species, Germany 2025
43% of cat keepers
Not reported
IVH and ZZF
Internet as main pet food channel, UK 2025
43% of owners
39% of owners
Loop survey via GlobalPETS
Regular booster vaccinations, UK
67%
81%
PDSA PAW Report 2025
Insured, UK
46%
61%
PDSA PAW Report 2025
The multi-cat home matters most for creative. When 43% of German cat keepers have two or more cats, the purchase is often made for a small group with different tastes, which is why texture packs and variety boxes sell (IVH and ZZF).
Online matters a little more for cats. A Loop survey of 3,081 owners in August 2025 found the internet was the main pet food channel for 43% of UK cat owners and 39% of UK dog owners; in France it ranked second, at 35% for both (GlobalPETS, January 2026).
The vet matters less. In the PDSA's survey of 2,587 cat and 2,566 dog owners, 67% of cats had regular boosters against 81% of dogs, and 46% were insured against 61% (PDSA PAW Report 2025). With fewer vet visits, the product page and the ad carry more of the nutrition explanation, so the cat creative has to do more teaching.
Image generated with AI: a two-cat home at feeding time, each cat with a different wet food texture.
Need new ads? Describe your product and what you want to test.
A peer-reviewed study says it does. Jia, Yang and Jiang report across seven studies in the Journal of Marketing that exposure to dogs activates a promotion-focused mindset and exposure to cats a prevention-focused one (The Pet Exposure Effect, Journal of Marketing 86(5), 2022). The American Marketing Association's summary describes dog viewers as more eager and risk seeking and cat viewers as more cautious (AMA press release).
The study tested consumer choices in general, not pet food ads. For cat food the implication is a hypothesis to test: messages about safety, routine and reassurance may fit the mindset a cat on screen creates better than the energy and adventure common in dog advertising.
Test it, don't assume it.
How to audit your pet food creative budget for cats and dogs
The audit compares three shares your team already has. First, the share of revenue from cat products in each market. Second, the share of media spend behind cat products. Third, the share of live creatives (ads, product page images and videos) that show a cat as the main subject.
Divide each marketing share by the revenue share to get an alignment index per market. Say cats bring in 50% of your revenue in Germany but appear in 30% of live creatives: 30 divided by 50 gives a creative index of 0.6, so cat buyers see 40% less creative than their revenue would suggest. Close to 1.0 means the plan follows the money; below 0.8 deserves a decision on whether the gap is deliberate.
The only public cat and dog ad spend comparison found for this article is old and American: MediaRadar reported that from 1 January to 23 May 2020 dog food ad budgets in US media were 58% higher than cat food budgets (PetfoodIndustry, June 2020). It says nothing about Europe in 2026, which is why your own numbers matter more.
ScorecardDoes your cat creative match your cat revenue?Answer for one market at a time. Use last quarter's revenue and the ads that are live today.
Score: 0 of 3 · 0 of 2 answered
Answer every question to see the verdict.
How to read your score
Score
Verdict
What it means
-3 to -1
Cats get more creative than revenue
Your cat share of ads runs ahead of cat revenue. That can be a deliberate growth bet; if it is not, move production toward the dog range or the products that earn the money.
0
Roughly in line
The two shares sit in the same band. Check variety next: count how many distinct cat situations those ads show.
1
Cats slightly under-served
Cat buyers see a little less creative than their revenue would suggest. Work out the exact index as described above and decide whether the gap is a choice.
2 to 3
Cats clearly under-served
Cat revenue is at least two bands ahead of cat creative. Brief cat-led concepts for the next batch and test them against your current best ad.
A quick banded version of the alignment index explained above, built by AI Vidia for planning. It is not a benchmark of what the right split is.
Run it market by market. A brand that grew up in the UK will lean toward dogs, because the UK is the one large market where dogs clearly lead, and that weighting can spread quietly to France, Germany and Italy, where cats outnumber dogs by 2 to 7 million each.
What cat-specific pet food ads should show, and the claims they need cleared
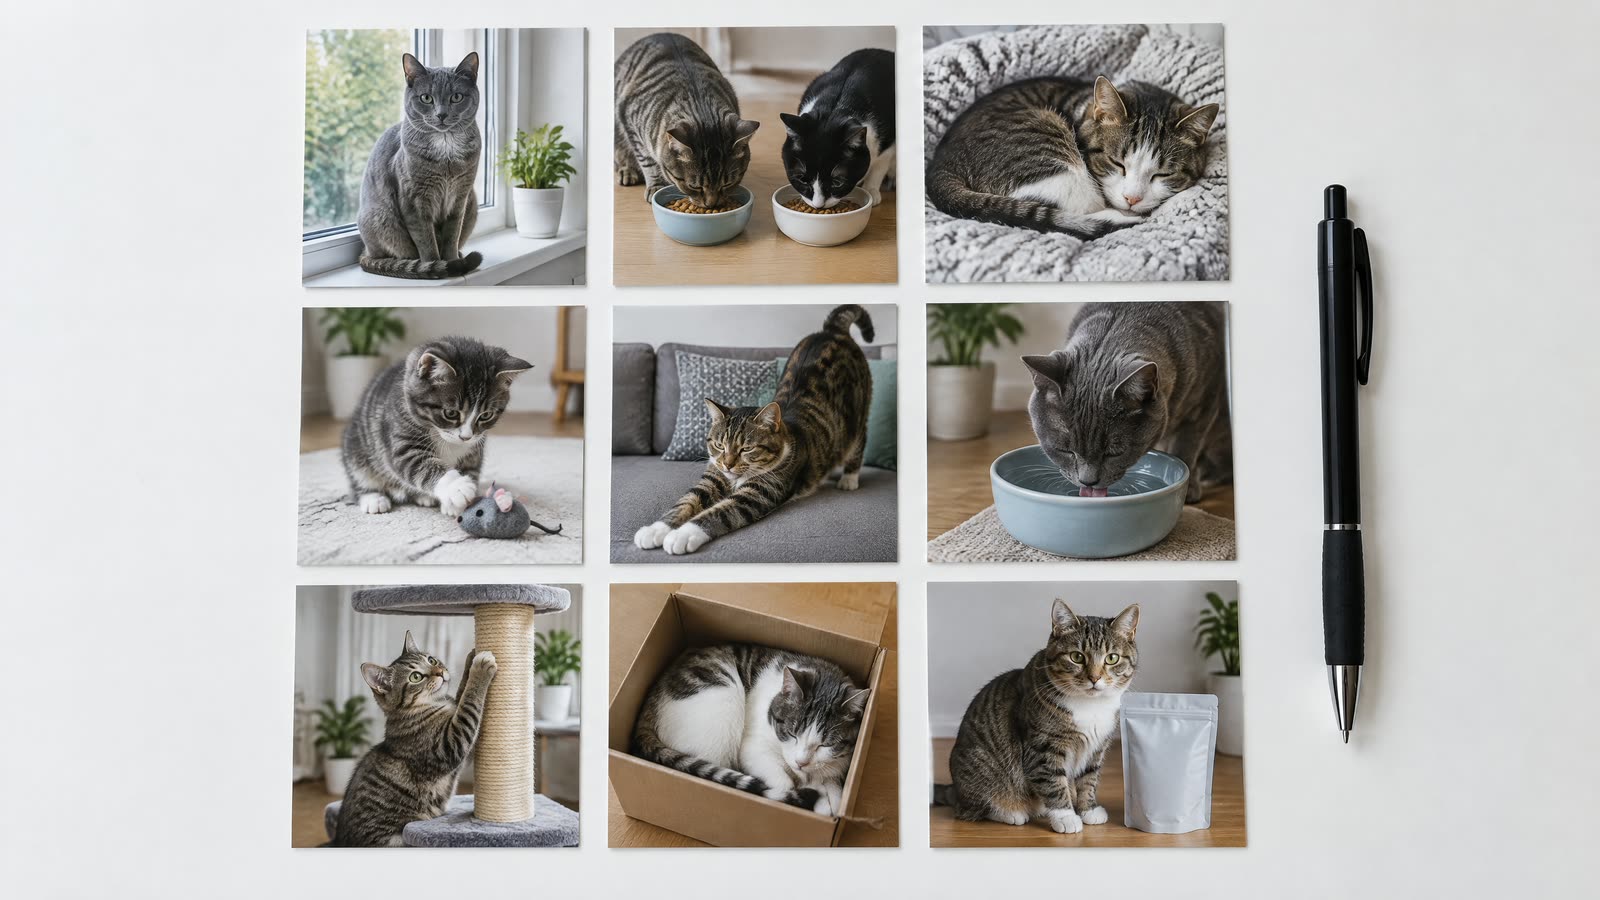
Count situations, not only cats. Ten cat ads that all show the same young cat in the same kitchen do not reach the owner with three cats, the owner of a senior cat or the owner of an indoor cat in a small flat.
The data points to four situations with commercial weight: the multi-cat home choosing between textures, the daily wet food routine, the indoor cat whose owner watches weight and hairballs, and the owner who rarely sees a vet and looks for reassurance in the product itself. Each needs its own opening scene and first line.
Image generated with AI: a contact sheet of distinct cat situations, the unit to count in a creative audit.
Cats have been expensive to film because they cannot be directed the way a trained dog can, and that cost keeps cat creative thin. Generated production lowers it, provided a reviewer checks that the animal moves like a real cat; our AI image ad production and AI video ads lock the cat as a character across a set, and the pet brand page shows examples.
Many of the strongest cat messages sit close to health, which is where claims get strict. Urinary and kidney support can only be sold as a particular nutritional purpose when the product is a dietetic feed that meets Regulation (EU) 2020/354.
Cat-relevant entries in the EU list of particular nutritional purposes. Source: Regulation (EU) 2020/354 Annex I (OJ L 67, 5 March 2020). Each entry also requires the label to recommend seeking veterinary advice.
Particular nutritional purpose
Recommended feeding time
Support of renal function in case of chronic renal insufficiency
Initially up to 6 months
Dissolution of struvite stones
5 to 12 weeks
Reduction of struvite stone recurrence
Initially up to 6 months
Reduction of oxalate stones formation
Up to 6 months
Anything outside that list stays a support claim, and no pet food may claim to prevent, treat or cure a disease. The full rules for EU and US pet food claims, green claims and AI labels are in Kenneth Dosanjh’s guide to growing value per pet.
A cat and dog audit you can finish this week
Pull three numbers per market: cat revenue share, cat media share and cat creative share. Calculate the two indexes, then list every live cat creative by situation. A gap below 0.8, or fewer than four distinct cat situations, is the brief for your next batch.
Today's task takes 25 minutes. Export last quarter's revenue by species for your biggest market, count the live ads that show a cat as the main subject, and divide the second share by the first. Write the index at the top of your next creative brief.
Frequently asked questions
01How many cats and dogs are there in Europe?
FEDIAF counts 110.9 million cats and 91.2 million dogs in 41 European countries in 2024, out of 306 million pets in 140 million households. The pet total includes 28 million aquaria; without them it is about 278 million.
02Is cat food a bigger market than dog food in Europe?
Cat food is the bigger market by value. FEDIAF reports that cat food accounts for 50% of European pet food sales value and dog food for 46%, even though dog food makes up 58% of the volume produced against 41% for cat food. The value split comes from 11 national associations covering 91% of reported volume.
03Which European countries have more cats than dogs?
France, Germany and Italy have more cats than dogs in FEDIAF's 2024 figures, as do the Netherlands and the Nordic countries. The UK, Poland and Spain have more dogs; UK Pet Food's January 2026 survey counts about 15.5 million dogs against about 13 million cats.
04Is cat food growing faster than dog food?
Cat food has grown faster than dog food in the latest figures. Euromonitor’s world pet care report puts cat food growth at a compound 6% a year from 2020 to 2025 against 3.8% for dog food. In German stores, IVH and ZZF report cat food up 1.3% in 2025 while dog food fell 0.3%.
05How do I know if my creative budget is balanced between cats and dogs?
Divide the share of live creatives that feature a cat by the share of revenue from cat products, market by market. If cats bring 50% of revenue and appear in 30% of creatives, the index is 0.6. An index below 0.8 means cat buyers see clearly less marketing than their spending suggests.
How we made this article
Sources were read on 13 October 2026. Cat and dog counts and sales shares come from FEDIAF's 2026 report (data year 2024), German figures from IVH and ZZF, UK figures from UK Pet Food and the PDSA. The alignment index, its example and the scorer are AI Vidia's planning method, not a measured benchmark.
We research and draft with AI assistance and check figures against the sources below.